Unity Cluster Debug
Debugging a cluster application#
Testing your cluster application on a single computer#
You can run your cluster application on one single computer for easier testing.
You can simulate a cluster by creating a configuration where both the server and client are on the same machine. This will run two instances of your application on your computer.
Make sure to run MiddleVRDaemon and using the same IP address (or localhost).
See the template configuration VirtualCluster.vrx in the installation
folder of MiddleVR: C:\Program Files\MiddleVR2\data\Config\Default\VirtualCluster.vrx.
Debug any cluster node in Unity Editor#
MiddleVR offers an invaluable tool to debug your cluster applications: the ability to use the Unity Editor as any of your cluster nodes (server or client) for easy debugging.
There are a few requirements to make this work correctly:
- You need to export the application with the correct scene enabled and make sure to re-export it after any modification (scene or scripts).
- Your configuration must use the Compositor.
- The Game View must always be visible, otherwise the rendering stops and this freezes the application. The best layout is simply to have the Game and Scene view side-by-side.
Then simply check the Editor Cluster Debugging Properties below and press play.
Note: You might see one frame delay or some slight colorimetry differences between the cluster node being debugged and the other nodes. This will not happen when running the application using only standalone/built players.
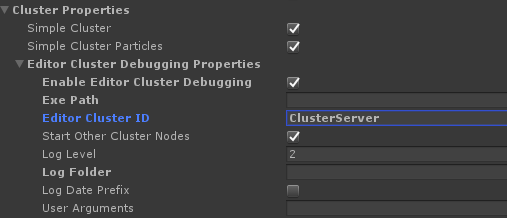
- Enable Editor Cluster Debugging : When checked, will enable the Editor Cluster Debugging feature
- Exe Path : Path to exported application. If empty will automatically find the latest exported player path
- Editor Cluster ID : Cluster ID of the current editor. If empty, will be ClusterServer
- Start Other Cluster Nodes : When checked, will automatically start the other cluster nodes. If Editor Cluster ID is a client, this will also start the server
- Log Level, Log Folder, Log Date Prefix, User Arguments : Same arguments as MiddleVR Config Debug properties
Debugging multiple cluster nodes#
On different computers#
By default with the Editor Cluster Debugging feature you can only debug one cluster node at a time. If you want to debug multiple nodes at the same time on different computers, you need the following:
- Have Unity Editor installed on all the machines you want to debug
- Have the exact same project on all the machines you want to debug
- Correctly specify the Editor Cluster ID for each Editor
- Modify your configuration file to mark each of the needed cluster nodes as "StartManually"
- Start the ClusterServer first. The best is to leave "Start Other Cluster Nodes" enabled so that all the cluster nodes that are not tagged as "StartManually" will be correctly started.
- On the cluster clients, disable "Start Other Cluster Nodes" and press Play.
- You should now have all your cluster nodes ready for debug. Each cluster node will wait for all the others at each frame so make sure to not forget to continue all cluster nodes.
- If you do a modification on one computer, make sure it is synchronized on all computers.
Locally#
Locally is the same procedure as with different computers. The main issue is that Unity does not allow multiple editors to open the same project. The trick is to copy the project to a different location and open the copy. Make sure to synchronize any modification you make with one project to the other projects.